Pages

Thursday 9 May 2019

Technical Trading Indicators - Why Traders Turn To Them?

technical trading indicators
 All participants from traders, investors, to producers in the volatile energy markets such as natural gas, fuel oil, crude oil, and other refined products, count on technical trading indicators since these indicators allow them to time trades. Even investors oriented to underlying fundamentals can take advantage, by knowing about the mechanics of technical indicators, letting them form realistic opinions on new and existing trades.
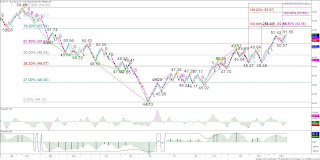
Technical analysis typically reproduces what markets know about themselves, along with what is being indicated in price and on charts. The information obtained, lets the Kase StatWare pinpoint patterns and show it as clear, color-coded signals on the charts, that are easy to monitor and decipher. The trading signals allow the user to learn a trend’s direction & strength. Primarily, the technical indicators allow forecasting the direction of future prices.

Trading Indicators Tell The Direction Of Future Prices

The technical trend indicators typically allow one to ascertain the direction and strength. These indicators use price averaging to set down a baseline - as price moves above the average it’s deemed as a Bullish trend, and as prices move below the average it flags a Bearish trend. These Trend indicators allow the market participants to determine when to enter and exit a trade.
Moreover, these Trend Indicators enable you to pick out trend reversals. Meaning, you are able to recognize when a trend has ended and a move in the reverse direction is happening. So, they actually allow you to find the reversals in a commodity’s price direction.

What to Look For In Technical Trading Indicators?

There are certain aspects that distinguish the best technical indicators from the ordinary trading indicators, such as:

Clear Color-Coded Charts

Yes, this is a feature that makes the indicator easier to read on the chart. The human brain can process colors faster as opposed to other types of information. With color-coded charts, you can detect opportunities with ease, and determine the risks involved. Additionally, bar patterns allow you to extract meaning out of these charts and you’ll be able to approach every trade like a pro.

Statistical Charts

To decide which trading indicators are reliable, you should find out what they are based on. What distinguishes the reliable trading indicators, is the quality of mathematical algorithms as a statistical model that define downtrends, corrections, and low-risk patterns.

Filtering Options

This is also another key quality that makes a technical trading indicator unique. To be effective a trading indicator should not only allow you to filter signals for accuracy but also allow you to make quick decisions watching charts in high detail with multiple time frames. If these features are found in a trading indicator you should rest assured that you will be able to explore countless opportunities that the markets present to you. The trading indicators based on statistical and mathematical principles look at historical price moments to make accurate predictions for the future. The more you study these indicators, the better you will be able to read the macro and micro signals.

Conclusion

Technical trading indicators draw on predefined mathematical formulas and provide with a trader with good insight, on all that is taking place in the market. Historical prices, the performance of the security, trend direction and strength, everything that you are seeking after is presented before you. To conclude, Kase StatWare is based on statistical and mathematical principles are used commonly by traders and investors to time entries, place stops, and exit trades in a timely manner.

Wednesday 9 May 2018

Crude Oil Price Forecasting Methods

Can anyone accurately predict the long-term outlook for crude oil prices? Is there a definitive method to determine which direction the commodity will sway over the next few years? The short answer is no, not reliably at least. There is no analyst or commentator who can unequivocally figure the long-term price of oil. For each forecast that states a $100 per barrel high, there's another to postulate a low of $40.

Nevertheless, crude oil was and is a very important tradable energy commodity and understanding it bias, direction, and the important support and resistance levels is crucial for energy traders. At its core, the price of crude oil, a commodity, is most importantly driven by supply and demand. But, it is not that simple. The price of crude oil is influenced greatly by several unpredictable past/present/future events like weather, stock levels, GDP growth, geopolitical aspects and people’s expectations or sentiment. All these factors create a strongly fluctuating market and why accurately predicting the long-term price for crude oil is nearly impossible. However, when it comes to forecasting the price of crude oil in the short-term, over the next few days, weeks, and in some cases, even months is achievable using quantitative factors such as technical analysis.

Quantitative Methods to Forecast Oil Price

Generally, market technicians and energy commodities analysts are the professionals who make short-and medium-term predictions on the crude oil market. These experts use mathematical, statistical, and technical models, which either focus on financials (using spot and future prices), or supply and demand factors - quantifying variables and testing their explanatory power.

Spot and future price models are still popular with the technicians and statisticians to make a realistic energy price forecast. The main idea is that futures markets, especially the relation between futures price fluctuations and spot price fluctuations, will indicate the direction of tomorrow's crude oil prices.

Once could also use supply and demand models that emphasize macroeconomic variables such as OPEC production, income elasticity of demand for oil, and real gross domestic product (GDP). However, since there are so many and varied possible combination of variables it is challenging to know what factors are most important and at what time those factors are having the most effect on the price of oil.

Technical analysis is one of the best ways to forecast oil prices over the short-term. The idea behind technical analysis is that everything is discounted in price. Therefore, a technical analyst does not necessarily have to worry about what geopolitical, supply demand, or other macroeconomic factors are driving price. Rather, the technical analyst can use chart patterns, indicators, and mathematical models to determine the future direction and price targets, potential turning points, and optimal trade entry and exit points.

Kase Crude Oil Commentary – Technical Analysis Forecast


One such service that utilizes technical analysis to forecast the future price of crude oil is the Kase Commentary on Crude Oil. For over 25 years Kase has provided clients with in-depth and highly accurate weekly prices forecasts and daily updates. The analysis is purely technical and balanced against underlying fundamental and geopolitical pressures on prices. It is a short-term forecast that focuses on the next few weeks and outlines the impacts of the longer-term outlook.If you are interested in a complimentary four-week trial, please visit http://www.kaseco.com/energy-price-forecasts/.

Wednesday 20 September 2017

Energy Risk Management - It Goes Much Beyond Options

energy risk management
If you were to pose the question what is ‘energy risk management’ to market pundits, don’t be surprised if the definition is as varied as the individuals articulating them. Many of these pundits have an academic approach to energy trading and hence they come up with theoretical suggestions that often contradict actual movements in the market. What is common though, is most of them see risk management as a function of ‘options’ and you would come across thousands of posts and blogs that talk about options.

This particular problem arises from the fact that many experts who have called it right in the equity markets where there is more liquidity and get into the role of issuing sermons for energy trading. Apart from few technical similarities it is similar to comparing apples and oranges. Many of their calls are made on theoretical study of the market rather than a scientifically backed analytical study where tons of data in analyzed and turned into meaningful information. Whether you want to protect margins, minimize your exposure to risk or secure your budget you need to listen to specialists who analyze data with statistical models.

Analytical & Meaningful Suggestions

When you opt for trading advisory from a reputable agency that has expertise in energy risk management they offer you treasure trove of information to make the right calls. Instead of boring paragraphs of text they would present to you color coded charts that are easy to read and make sense of. Whether you want to set up a risk management goal or strike balance between risks and rewards in highly volatile energy market these agencies offer tailored advisories and strategies based on your current exposure in the market, risk appetite and future goals.

As a business whose financials are directly linked to energy trading you need to work with such strategists. Their years of experience and in-depth working knowledge of the market with benefit you in multiple ways. From helping you choose the right trading instrument to customizing scale-in strategies for your needs they minimize the risk associated in energy trading. They help you shield your investments from recurring risks and also improve your odds of making sound financial decisions.

As we have mentioned it earlier, energy risk management goes much beyond options and you should keep your own ‘options’ open by working with experts.

Tuesday 19 September 2017

Energy Trading Advisor

There are thousands of ‘rags to riches’ tales in the energy sector. Since the beginning of the Industrial Revolution there is no other business sector that turned average individuals into millionaires and graduated the lucky few into the list of billionaires like the energy sector. Nevertheless, the risk here is higher compared to any other commodity traded in the market. It’s a double edged sword where, as a market participant, you should measure your steps carefully. At Kase and Company, Inc., we help in mitigating risk and maximizing your returns from energy trading and energy risk management. As the leading Energy Trading Advisor with exposure to trading around the globe we offer you unmatched trading and hedging analysis and services based on our qualitative as well as quantities expertise.

Our long list of satisfied clientele includes individual traders, energy producers and consumers, marketers, financial institutions as well as institutional investors whom we help with hedging, trading and risk management. We have built robust solutions allowing our clients to trade effectively in volatile energy commodity markets in every corner of the globe. Advent of electronic trading has had a huge impact on energy markets and we make use of the latest tools to stay ahead of the competition.
Research Driven Services

If you trading energy based on instincts there is a lot of risk attached to such transactions. We help you mitigate these risks with our research and analysis driven services. Our experienced analysts keep a tab on the technical and statistical factors that influence trends in the energy sector and prices of energy commodities. This allows us to offer you great energy forecasts and market timing software and indicators to help you optimize your trading and hedging results.

We understand the power and importance of using technology and automated analysis tools in helping understand trends in the market faster, and offering more accurate advisory services. Our investment in creating cutting edge tools such as these, let us offer our clients winning insights into the oil, gas, and electricity markets.


Energy trading is no gamble but a sound way to improve portfolio results that requires well-planned approach and taking market behavior in stride. We offer you services and actionable intelligence to realize your trading and hedging strategies.

The Realm of Stocks is Complicated

Technical Trading Indicators
 Technical analysis has become an important aspect of the financial markets. There is little doubt that mathematical and statistical methods and trading models are becoming more widely used by traders and analysts. Technical analysis is used by a growing number of experts.

What is This Analysis?
Technical analysis is the study of charts and historical price action that helps traders and analysts determine what markets might do next. The basic idea behind technical analysis is that everything is discounted in price. In other words, if a trader has information that he believes will cause a stocks prices to rise, and he and other traders begin to buy based upon that information, the stock price will rise. It does not matter what that information is, but rather that the market rose. That is really all a market technician is worried about, that prices rose, not why they rose.

As prices rise, patterns begin to form. These patterns reflect the ebb and flow of the market and can be used to determine the strength of a trend, where a market might turn or stall, if a move is going to continue, sentiment, and many other factors.

Therefore, technical analysis of stock allows traders and analysts to study the market using historical data so that they can determine if a market is going to rise or fall without having to know every fundamental detail about that market.

Why indicators?
An individual may have done the research on a company, assessed their balance sheets, and taken into picture the P/E ratios and different projections. For some, this thoroughness is important when trading stocks. However, these fundamental factors do not tell the trader when to buy or sell the stock, when a trend is exhausted, or how much they should be willing to risk. Technical analysis gives them the answers to those questions.

Belief of Experts 
Professional and experienced traders believe that the first thing any trader must know about a market is its trend. A market can do just three things – it might go up, it might go down, and it might go sideways. Momentum indicators help a trader gauge trend direction and strength. Momentum indicators include such traditional studies such as RSI, Stochastic, and MACD, as well as more advance indicators such as the KasePO and KaseCD.

What is a Momentum Indicator?
A momentum indicator studies and measures the rate of change of price. There are various ways of doing this that are outside the scope of this article. Momentum indicators tell a trader the direction of a trend, its strength, whether price is overbought or oversold, and when a trend is becoming exhausted (using a technique called momentum divergence). Momentum indicators are extremely powerful tools that may be used to time entries and exits.

Conclusion 
The bottom line is that technical analysis and best trading indicators can help you become a better trader by helping you learn when to time entries and exits, how much risk to take at any given time, how strong or weak a trend is, and when a statistically significant turn is about to take place. 

Monday 27 March 2017

How a Technical Trading System Fosters Rewarding Strategies

When it comes to trading your success rests on trusting your strategies. Based on your investment goals you would have to abide by a set of trading rules. This means buying and selling at the most opportune times based upon your trading style, goals, and risk appetite. However this isn't as easy as it sounds and requires you to know the pulse of the market. You should have clear idea of whether the market is trending, correcting, price targets, and most importantly, when to time entries and exits. A great way to gain this deep insight is using a technical analysis trading system. It offers you a bird's eye view of the market and helps you make informed decisions.

Counting What Matters
In the markets it's important to separate information from noise. There are lots of market indicators that predict direction, but the fact is most of them are based upon outdated simplistic techniques. A well-designed technical trading system. Uses current and historical prices, multiple dynamic time frames, and a bevy of indicators to identify the most opportune entries and exits.

Eliminating Assumptions & Sentiments
If you aren't using any technical based trading system most of your investment decisions would be based on assumptions, fundamentals, and market sentiment. A technical system offers insights into the market based on data that may include price movements, momentum, sentiment, and breadth. The system uses pre-defined rules to make informed decisions from this data.

Lets You Time It Perfectly
As mentioned, you need to make your moves in the market at the right time and this is exactly what a technical system would help you do. When you are armed with the right trading tools you would be able to time entries and exits when taking long or short trades.